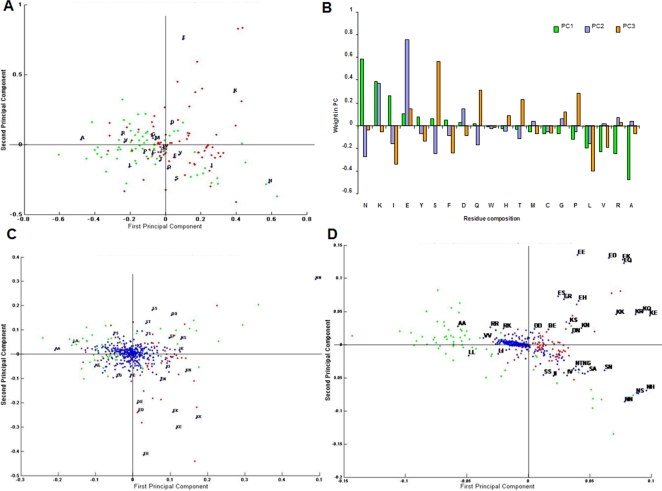
Figure 3. Component loadings for the first two Principal Components (PC).
(A, C, D) Superimposed plot of component loadings of features used (AAC, DPC and PSSM) and training dataset from PCA analysis - showing the feature usage variability, thereby showing what degree the original variables contribute to the PCs. The plot signifies the correlations between amino acids by virtue of its loading scores as well as relative abundance in cyclins and non-cyclins to each of the PC analyzed. Green, red and blue spots represent cyclin, non-cyclins and component loadings of feature used, respectively. (B) PC weight plot of each of the 20 amino acids for the first three PCs of AAC model. The plot signifies the discriminative properties of amino acids to specific PCs by virtue of its loading scores.

