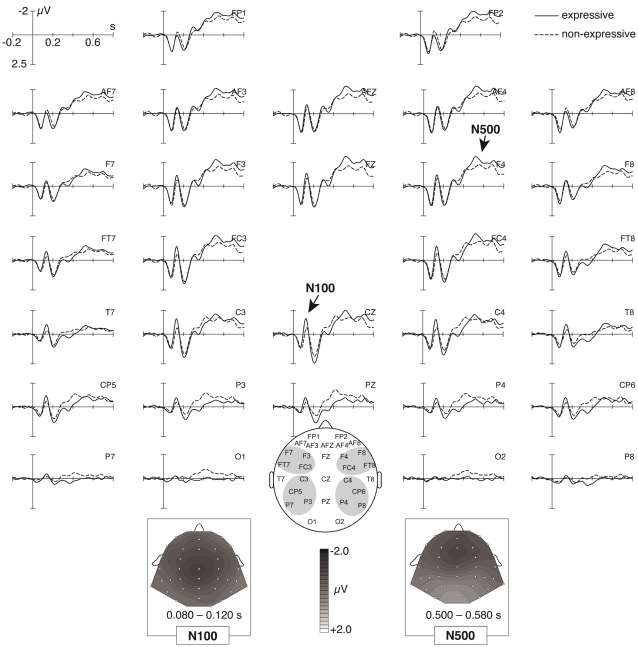
Figure 5. Grand-average of brain electric responses to expressive and non-expressive chords (averaged across expected, unexpected, and very unexpected conditions).
Expressive chords elicited a negative effect in the N100-range (being maximal at central electrodes), and an N5 that was larger than the N5 elicited by non-expressive chords. The bottom insets show isopotential maps of the N1 and N5 effect (non-expressive subtracted from expressive chords).

