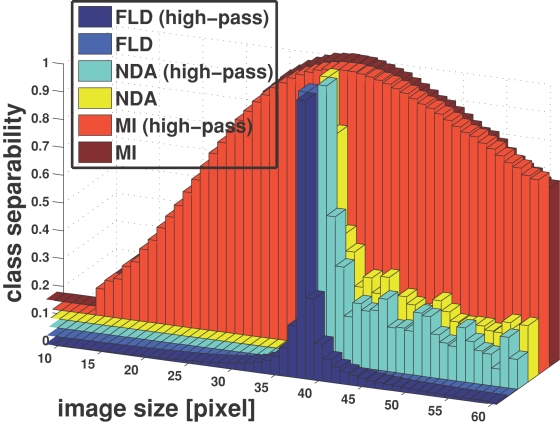
Figure 2. Class discriminability measures.
The graphics shows normalized class discriminability measures as a function of image size (or spatial frequency). Different measures are distinguished by their color, as indicated in the figure legend: FLD = Fisher Linear Discriminant Analysis, NDA = Non-Parametric-Discriminant-Analysis,and MI = Mutual Information. All three measures consistently peak at around the same image size of about 37×37 pixels, corresponding to ca. 16 cycles per face width (see Fig. 2C). See text for further details.

