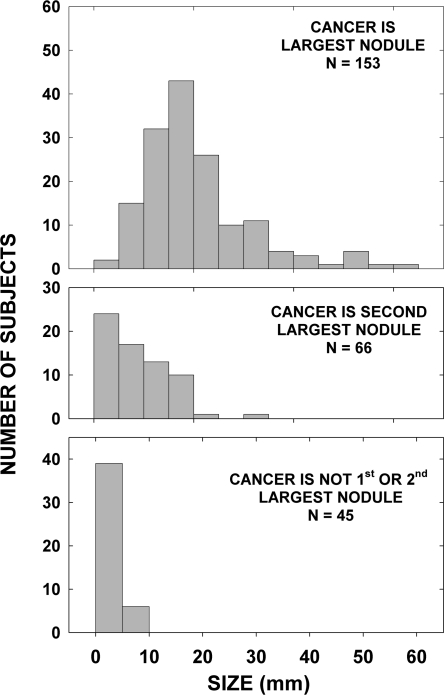
Figure 2.
Cancer size by rank order of the largest cancer. The figure shows frequency histograms of the distribution of cancer size when the cancer was the largest (upper panel), second largest (middle panel), or the third largest or greater lesion (lower panel) among all of the nodules (benign and malignant) in 297 patients with thyroid cancer.

