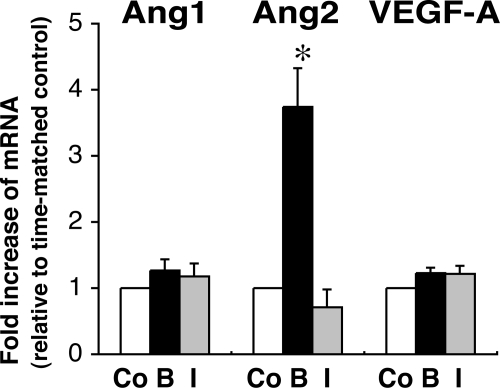
Figure 5.
Effects of FGF-2 or IGF-II on Ang1, Ang2, and VEGF-A mRNA levels in DZ cells. Isolated DZ cells were exposed to FGF-2 (basic FGF) (B) (10 ng/ml) or IGF-II (I) (100 ng/ml) for 24 h. For comparison, GUS-normalized values are presented as fold increase relative to time-matched, unstimulated controls (Co) (arbitrarily presented as one). Data shown are from three experiments using different adrenals. *, P < 0.01, vs. time-matched, unstimulated control.

