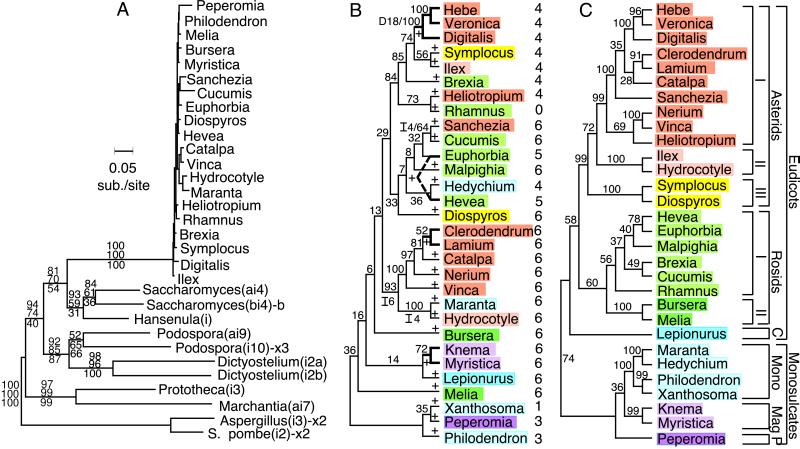
Figure 3.
Phylogenetic history of the cox1 intron. (A) Maximum-likelihood tree of the cox1 and all related introns. Bootstrap values for each node are shown in a column above and below the corresponding branch and are, from top to bottom, from neighbor-joining, parsimony, and likelihood analyses, respectively. Introns located at the same cox1 position as in this study are unmarked; introns at two other positions in cox1 are marked “x2” or “x3”; and an intron in the cob gene is marked with a “b.” (B) Maximum-likelihood tree of 30 angiosperm cox1 introns. Numbers on the tree are bootstrap values. The four synapomorphic intron gaps (which were not used to build this tree) are marked by “I” or “D” (for insertion or deletion relative to the Peperomia intron) followed by the gap’s length in bp. + signs on the tree mark 25 inferred gains of the intron among these 30 taxa. Color-coding is as in Fig. 3C. Numbers at right indicate number of 3′-flanking nucleotides changed by coconversion (see Fig. 4B). Bold branches mark four small clades of introns thought to have originated from the same intron gain event. (C) Organismal tree from a maximum-likelihood analysis of a combined data set of chloroplast rbcL and mt cox1 coding sequences, excluding the coconversion region (see Fig. 4). Numbers are bootstrap values. Color-coding is as described in the text. C, caryophyllids; Mono, monocots; Mag, Magnoliales; P, Piperales.

