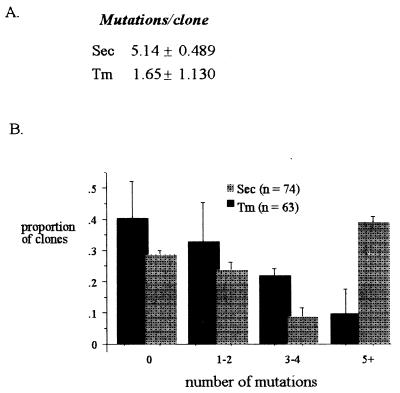
Figure 1.
The frequency of mutations and their distribution among Tm and Sec clones. (A) Sec clones (n = 74) had a significantly higher number of mutations than the Tm clones (n = 62) (P < 0.05, one-tail t test for paired comparisons). Shared mutations in oligoclonal families were counted once. (B) The proportion of clones with a large number of mutations (>5/clones) was also highest in the Sec clones (P < 0.05, Kolmogorov-Smirnov Test).

