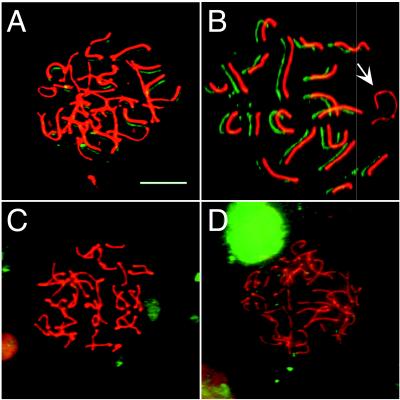
Figure 3.
Molecular analysis of morc spermatogenic arrest. Immunofluorescence analysis of spermatocytes from 24-day-old morc +/− (A and B) or −/− (C and D) mice, with anti-COR1 (red), recognizing mouse SYCP3, and anti-SYN1 (green), recognizing mouse SYCP1. The green image is deliberately offset from the red image to facilitate visualization of coincidence of staining. (A) Normal zygotene spermatocyte from a +/− mouse, with well-developed axes staining with anti-COR1; these axes are not completely paired, and initiation of synapsis is recognized by staining with anti-SYN1. (B) Normal pachytene spermatocyte from a +/− mouse; note coincident immunoreactivity for SYN1 with all axes indicating full and complete synapsis, except for the sex chromosomes (arrow), which normally synapse only in the most terminal region. (C) Abnormal zygotene-like spermatocyte from a −/− animal. Even though full axial elements are formed, no pairing is seen. (D) A morc −/− zygotene spermatocyte with focal regions of initiation of synapsis. (Bar = 10 μm.)

