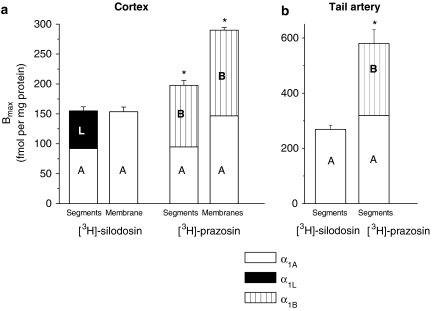
Figure 3.
The binding capacity and pharmacological profile of [3H]-silodosin and [3H]-prazosin binding sites in rat cerebral cortex (a) and tail artery (b). High- and low-affinity sites for prazosin at [3H]-silodosin binding sites were represented as α1A (A) and α1L (L), respectively. Likewise, the number of α1A (A) and α1B (B) ARs was estimated from the proportions of high- and low-affinity sites for silodosin at [3H]-prazosin binding sites, respectively (see the text for further details). Bmax values represent the mean±s.e.mean of 4–5 experiments. Segments: intact tissue segment binding. Membranes: crude membrane binding. *Significantly different from [3H]-silodosin binding sites (P<0.05). Bmax, maximal binding capacity.

