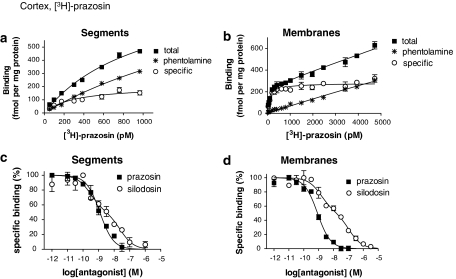
Figure 4.
Saturation curve for [3H]-prazosin in the intact tissue segments (a) and crude membrane preparations (b) of rat cerebral cortex, and competition curves for prazosin and silodosin at 300 and 3000 pM [3H]-prazosin binding sites in the intact tissue segments (c) and membranes (d), respectively. Each figure is representative of similar results obtained in four other experiments.

