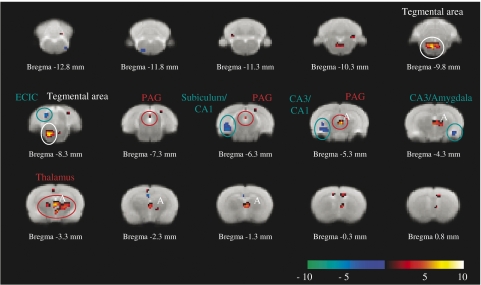
Figure 4.
BOLD signal activity after 100 mg kg−1 infusion of GBP compared to saline. At this dose, GBP increased BOLD signal intensity (red–white gradient) over a number of regions of the thalamus and PAG (highlighted by A). Strongest decreases in BOLD signal intensity (blue–cyan gradient) were observed in the subiculum, CA1/CA3 regions of the hippocampus, amygdala and also in the ECIC region. BOLD, blood oxygen level dependent; CA1, field 1 of the hippocampus; CA3, field 3 of the hippocampus; ECIC, external cortex of the inferior colliculus; PAG, periaqueductal grey. Circles highlight voxels of interest listed in Table 2.

