
Figure 3.
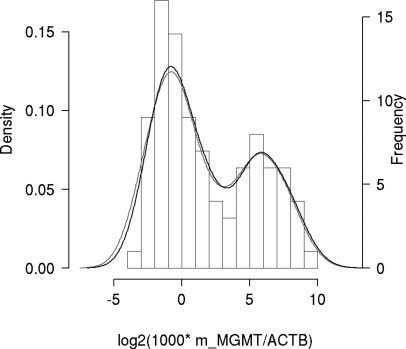
Density plot of normalized methylated MGMT copy number in glioma. Histogram of average results from 94 samples with duplicate measurements; the lines represent results from each replicate. Only samples with Ct values <40 for m_MGMT are included. The minimum of the density of the Gaussian mixture between the two local maxima is at the ratio of log2(1000 * m_MGMT/ACTB) = 3 (ratio value of 8).