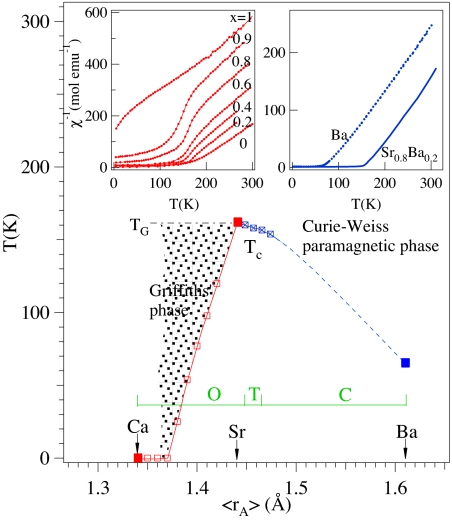
Fig. 3.
Phase diagram of the magnetic transition temperatures versus the tabulated average A-site ionic radius 〈rA〉 for Sr1−yBayRuO3 and Sr1−xCaxRuO3. Three members in the phase diagram CaRuO3, SrRuO3, and BaRuO3, in which the A-site size variance is zero, are distinguished by the solid symbols. The shaded area in the phase diagram represents the phase having the characteristic χ−1(T) of the Griffiths' phase. Letters inside the diagram stand for the crystal structure as determined by x-ray diffraction at room temperature, O for orthorhombic, T for tetragonal, and C for cubic. (Inset) Temperature dependence of inverse magnetic susceptibility of Sr1−xCaxRuO3 measured with a magnetic field H = 1 T (data are from ref. 28) and of Sr1−yBayRuO3 measured with a magnetic field H = 0.5 T in this work.

