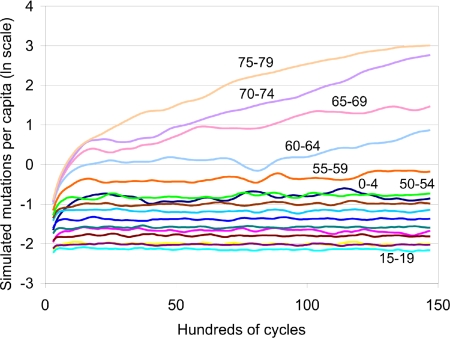
Fig. 2.
The time path of average number of mutations per simulated individual by year of simulation by age affected by mutation (501 point-centered moving average, natural log scale) for matriarchy specification with a population of 100,000. Shown are the first 15,000 cycles or 75,000 years of this simulation. Average frequencies for ages up to 55–59 stabilize by 15,000 years, but above age 60, frequencies keep rising. The ages corresponding to the lowest 10 lines at the far right in ascending order are 15–19, 20–24, 10–14, 25–29, 5–9, 30–34, 35–39, 40–44, 45–49, and 0–4. The other lines are labeled on the figure.

