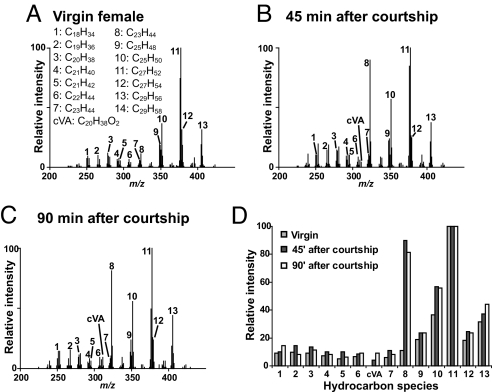
Fig. 4.
Chemical profile changes in the same individual female are observed before and after courtship. (A–C) Comparison of averaged positive ion mass spectra obtained from DART mass spectral analysis of the same female fly before (A) and at 45 min (B) and 90 min (C) after successful copulation. (D) A histogram of the relative intensities of each of the identified hydrocarbon species shows a relative increase in ion signal intensity corresponding to cVA, tricosene (peak 8), and pentacosene (peak 10) after copulation.

