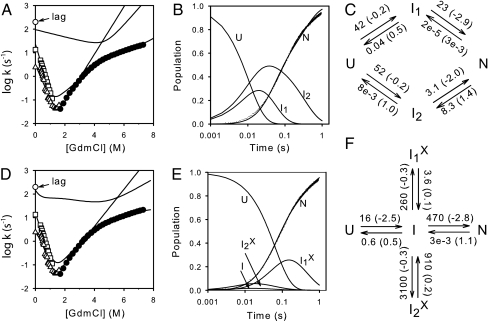
Fig. 2.
Global fit of the measured SNase kinetic folding and unfolding data by an IUP model (A–C) and a PPOE model (D–F). Shown are the chevron display of denaturant-dependent data (from Fig. 1), measured data for native-state acquisition at zero denaturant, and reaction schemes for the two different models with best global fit parameters (denaturant-dependent m values in parentheses). The curves drawn are the curves predicted by the best fit parameters for the denaturant-dependent chevron and for the time-dependent populations (zero denaturant) of the unfolded and native states and the two intermediates that significantly populate in the different models. A minor folding phase (amplitude ≈6%) on the 1-sec time scale (see Fig. 1A) was ignored.

