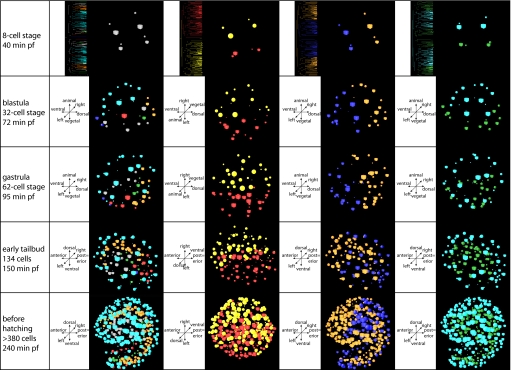
Fig. 3.
Virtual cell tracing experiments, using the 3D representation of the positions of the nuclei of each cell implemented in the 4D microscopy software SIMI°BioCell. Cubes derive from the left side (AB2); spheres derive from the right side (AB2). (Second column) Colors indicate tissues as in Fig. 1. (Third column) Red cubes derive from the left side (AB2); yellow spheres derive from the right side (AB2). Note that the orientation in this panel differs from the remaining ones to give a better view of the dorsal midline in the prehatchling state. (Fourth column) Orange shapes derive from dorsal cells A3 and A3, traditionally labeled “anterior” (see text for details); blue shapes derive from ventral cells B3 and B3, traditionally labeled “posterior.” Note that the center of orange colored nuclei shifts from dorsal to anterior between gastrula and early tailbud stage. (Far right column) Blue shapes derive from the animal cells a4.2, b4.2, a4.2, and b4.2; green shapes derive from the vegetal cells A4.2, B4.2, A4.2, and B4.2.

