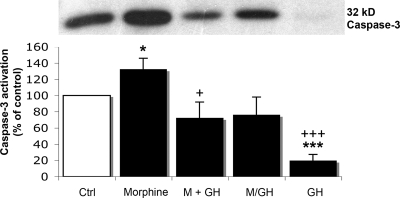
Fig. 4.
Effects of morphine and rhGH on caspase-3 activation in primary cultures of fetal mouse hippocampal neurons. (Upper) Representative Western blots of cleaved caspase-3. (Lower) Histogram representing caspase-3 activation. Ctrl, control; M, morphine (15 μM) for 7 days; M+GH, morphine (15 μM) together with rhGH (1 μM) for 7 days; M/GH, morphine (15 μM) for 3 days, followed by rhGH (1 μM) for 4 days; GH, rhGH, (1 μM) for 7 days. Values represent means from five different experiments in triplicate and are expressed in percent of control ± SE. ***, P < 0.001; *, P < 0.05 vs. control cells; +++, P < 0.001; +, P < 0.05 vs. morphine-treated cells. Note: the M/GH group is compared with cells treated with morphine for 7 days.

