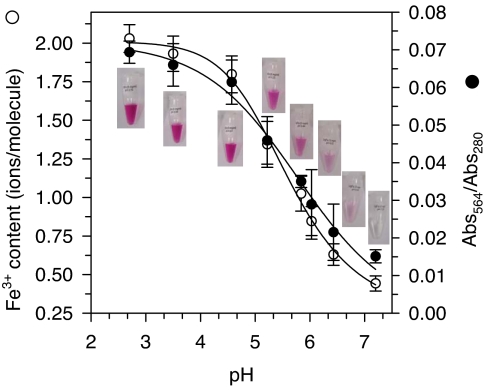
Fig. 2.
Iron (III) content, purple color, and low pH activity optimum of LigFa are coupled characteristics. Iron content (left y axis) and Abs564/280 (right y axis) vs. pH dependence was determined by equilibration of LigFa [(E) 0.3 mM], prepared by dissolving freeze-dried LigFa in 100 mM buffer at each of different pHs, followed by 24-h incubation at 25°C and extensive dialysis against the same buffer through a Centricon YM-10 membrane. The metal ion content was measured, after dilution of the enzyme solution with 5 ml of 0.5% (vol/vol) HNO3 to digest the protein and release metal ions (SI Text). The LigFa concentration was determined spectrophotometrically (ε280 = 52,322 M−1 ·cm−1, calculated from the amino acid sequence at www.expasy.org/tools/protparam.html). The characteristic color phenotype of protein solutions at each pH is shown.

