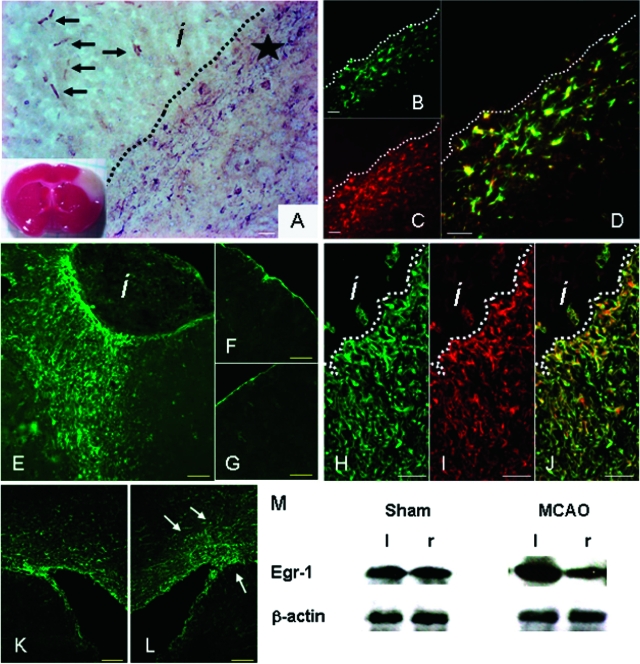
Figure 2.
Egr-1 expression in adult mouse brain after cerebral ischemia. A: Cerebral ischemia was induced by permanent occlusion of the MCA. The infarcted tissue appears white in the TTC-stained brain slice (inset). Immunohistochemistry using anti-Egr-1 antibody 4 days after MCAO detects Egr-1 expression in cells within the infarct area (arrows) and around the infarct border zone (star). B–D: Immunofluorescence analysis of brain tissue sections stained with anti-Egr-1 and GFAP antibodies 4 days after MCAO. Egr-1-expressing cells in the border zone (B, green color) stain positive for GFAP (C, red color). D: Double-labeled astrocytic cells appear yellow/orange in the superimposed images. E–G: High Egr-1 expression persists in cells around the injury site 6 weeks after infarction. Low-magnification images reveal strong Egr-1 expression (green) in cells accumulating around the infarct region (E) compared with the corresponding area of the contralateral hemisphere (F), or the ipsilateral area of sham-operated animals (G). H–J: Confocal microscopy images of brain tissue sections stained with anti-Egr-1 and GFAP antibodies 6 weeks after MCAO. Egr-1-positive cells (H, green) around and within the glial scar stain positive for GFAP (I, red). Double-labeled astrocytes appear yellow/orange (J). K and L: Confocal microscopy images of brain tissue sections stained with anti-Egr-1 antibody. K: The number of Egr-1-positive cells (in green) around the ventricles of infarcted hemispheres increases after MCAO (L, arrows) compared with contralateral controls. M: Western blotting detects higher levels of Egr-1 protein in scar tissue isolated from infarcted (left, l) hemisphere as compared with corresponding noninfarcted area of the contralateral side (right, r). β-Actin protein levels serve as control. Sham-operated animals have comparable Egr-1 amounts on both brain sides. Quantitative image analysis shows that Egr-1 protein levels are 2.3-fold higher in the peri-infarct region compared with control tissue (SD, 0.3), whereas sham-operated animals show equivalent amounts of Egr-1 protein in the corresponding areas of both hemispheres (0.98-fold difference; SD, 0.12). i: infarct; dotted lines demarcate infarct and peri-infarct areas. Scale bars: 100 μm (A, E–G, K, L); 25 μm (B–D, H–J).

