Figure 3.
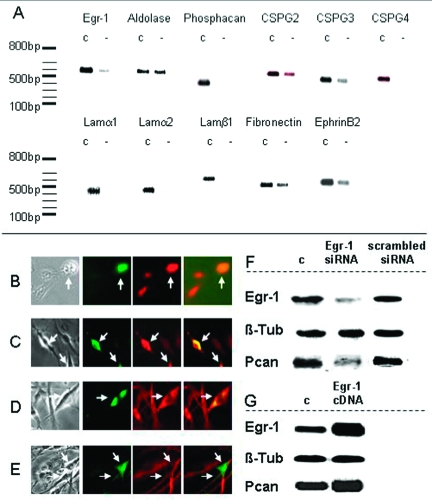
Egr-1 regulates genes involved in gliosis. A: Egr-1 loss-of-function effects on human astrocytes transfected with siRNAs against Egr-1. RT-PCR analysis shows that knockdown of Egr-1 leads to reduction in the expression levels of genes encoding ECM components of the glial scar. c, control mock-transfected cells; −, Egr-1 knockdown. DNA size markers are shown on the left. Gene name abbreviations are as follows: CSPG2, 3, 4, chondroitin sulfate proteoglycan 2, 3, 4, respectively; Lamα1, laminin α1; Lamα2: laminin α2; Lamβ1: laminin β1. Real-time PCR quantification of the effects of the Egr-1 knockdown on the expression of putative gene targets shows a 60% drop in phosphacan RNA levels in Egr-1 siRNA-treated astrocytes. Adjusted for aldolase, relative phosphacan expression was 12.96 ± 1.21 U in controls versus 5.05 ± 0.89 U after Egr-1 knockdown (n = 5, P < 0.001). B–E: Immunofluorescence analysis after Egr-1 overexpression in astrocytes transfected with the CMV-Egr-1-IRES-EGFP construct. Transfected, EGFP-positive cells (green, marked by arrows), stain more intensely with antibodies recognizing laminin α1 (B, red) and phosphacan (C, red, anti-RPTPβ) than nontransfected neighboring cells. No difference in expression levels of GFAP (D, red) or β-tubulin (E, red) between Egr-1-overexpressing cells (green, marked by arrows) and nontransfected cells. Superimposed images (far right) confirm that transfected cells express higher levels of putative Egr-1 targets, but similar levels of other proteins. F: Western blotting of proteins isolated from astrocytes transfected with siRNAs against Egr-1 (Egr-1 siRNA), control siRNA (scrambled siRNA), or mock-transfected cells (c). siRNAs against Egr-1 diminish effectively Egr-1 protein levels and lead to down-regulation of phosphacan (Pcan, detected with the KAF13 antibody). β-Tubulin (β-Tub) levels remain unaffected serving as control. Quantification of blot images shows that Egr-1 protein levels are reduced 3.0-fold versus control (mock-transfected cells; SD, 0.4) and 2.8-fold (SD, 0.2) versus scrambled siRNA-transfected cells; phosphacan protein levels are down-regulated 2.18-fold versus control (mock; SD 0.1) and 2.23 times (SD 0.1) versus scrambled siRNA. G: Western blotting of proteins isolated from astrocytes transfected with the CMV-Egr-1-IRES-EGFP (Egr-1 cDNA) construct or the empty vector (c). Egr-1 protein levels increase 2.08-fold (SD, 0.4) leading to 1.42-fold up-regulation of phosphacan (Pcan; SD, 0.14). β-Tubulin (β-Tub) serves as control.

