Figure 7.
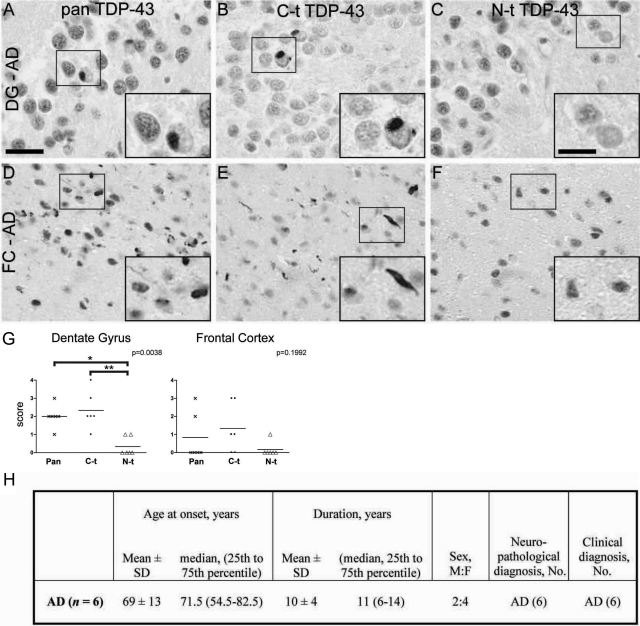
Differential C-t and N-t anti-TDP-43 immunoreactivities in AD brain. A–F: Adjacent sections of hippocampus (A–C) or frontal cortex (FC; D–F) from AD brains show robust labeling of neuronal cytoplasmic inclusions in the dentate gyrus (DG) and dystrophic neurites in FC using both pan TDP-43 antibody (A and D) and C-t TDP-43 pAb (B and E); in contrast, only marginal pathological staining is revealed with N-t TDP-43 pAb (C and F). High-power images corresponding to the boxed regions are shown in insets in A–F. Scale bars: 25 μm (A–F); 12 μm (all insets). G: Scatter plots showing individual values and means of the neuropathological immunoreactivity scores for pan-TDP-43 (crosses), C-t TDP-43 (dots), and N-t TDP-43 (triangles) pAbs. The diagrams display TDP-43 pathology score values from AD cases in hippocampal dentate gyrus (left) and frontal cortex gray matter (right). *P < 0.05; **P < 0.01 (Dunn’s multiple comparison post test). H: Summary of demographic characteristics of AD patients used in this study. F, female: M, male; No, number.

