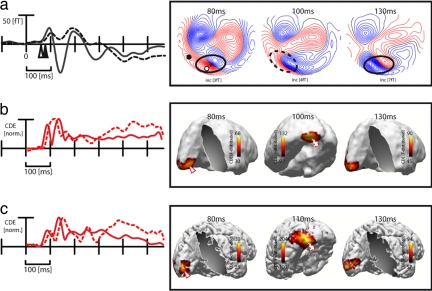
Fig. 2.
General waveforms/distributions and source localization results. (a) ERMF waveforms (total average across subjects) averaged across correct and incorrect TM trials at a central occipital (solid) and lateral occipitotemporal sensor site (dashed). The approximate location of the sensor sites are indicated by white and black circles in the distribution map. The arrowheads mark the onset of significant activity differences against baseline. Distribution maps at 80, 100, and 130 ms after search frame onset are shown on the right side. (b) Time course and distribution of sLORETA estimates of the total average response across subjects and conditions (correct TM trials). The red traces represent the time course of source activity at the source maximum in V1 (solid trace) and the left extrastriate cortex (dashed trace). (c) Time course and distribution of sLORETA estimates in a single subject.

