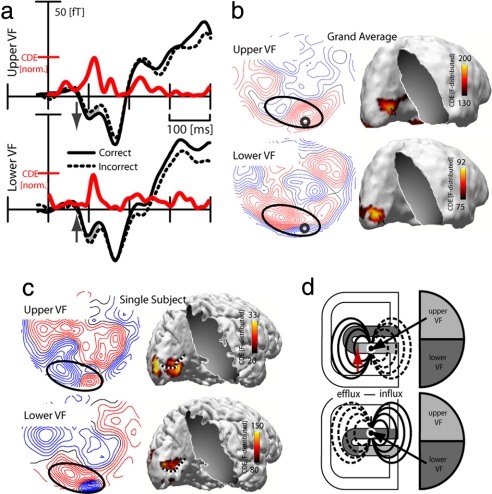
Fig. 3.
Awareness related effects. (a) Average ERMF waveforms (black traces) for correct and incorrect TM trials of targets in the upper and lower VF. The gray areas highlight the time range of significant differences. The red traces illustrate the time course of source activity (estimates based on the correct-minus-incorrect difference of TM trials) at the calcarine fissure maxima for upper and lower VF targets (red arrows in b). (b and c) ERMF maps and sLORETA estimates of the correct-minus-incorrect difference for TM trials in the upper and lower VF at 110 ms. The total average across subjects and the single subject are shown in b and c, respectively. The small circle in b marks the sensor position from which the waveforms in a were recorded. The dashed line in c marks the localization of the calcarine fissure. (d) Illustration of the cruciform model. The horizontal meridian is slightly displaced toward the lower bank of the calcarine fissure (red arrow; see Experimental Procedures for details).

