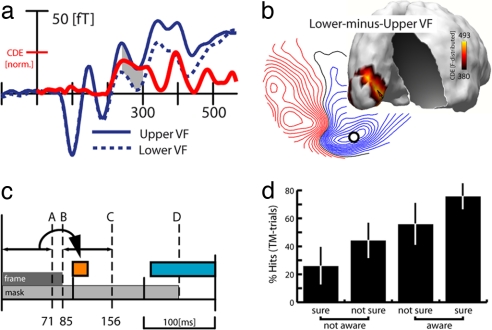
Fig. 4.
Attention-related effects. (a) Average ERMF waveforms (blue traces) elicited by correct TM trials of targets in the upper and the lower VF. The red trace represents the time course of source activity (estimates of the lower-minus-upper VF difference) at the calcarine maximum (red arrow in b). (b) ERMF distribution of the lower-minus-upper VF difference and corresponding sLORETA estimates at 280 ms. The small circle marks the location of the sensor site where the waveforms in a were recorded. (c) Illustration of the timing of frame B and mask D relative to the onset of the feedforward-driven activity in V1 A, the time range of significant awareness-related (orange) and attention-related (blue) activity. C marks the time point at which the frame-offset transient would arrive in V1 (frame duration of 85 ms plus 71 ms for the visual input to arrive in V1). (d) Control experiment. Percentage of correct target discriminations as a function of the subsequent awareness judgement of the observers.

