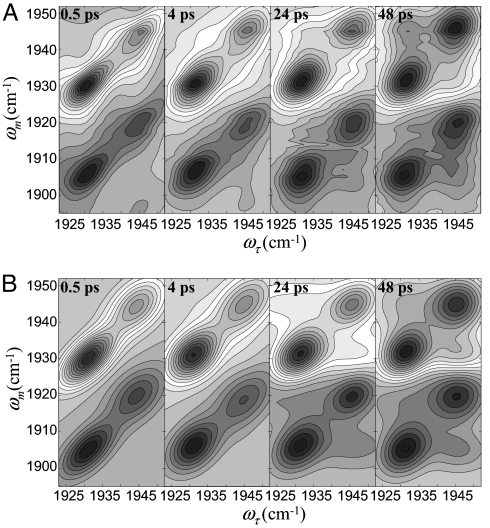
Fig. 2.
2D-IR spectra of CO bound to L29I. (A) 2D-IR spectra of L29I-CO at various times, Tw. Each contour corresponds to a 10% signal change. The bands in the upper half of the spectrum (positive-going) correspond to the 0–1 vibrational transition. The bands in the lower half of the spectrum (negative-going) arise from vibrational echo emission at the 1–2 transition frequency. (B) Calculated 2D-IR spectra of L29I-CO at various times, Tw, using the known input parameters and the substate switching time constant obtained from fitting the data.

