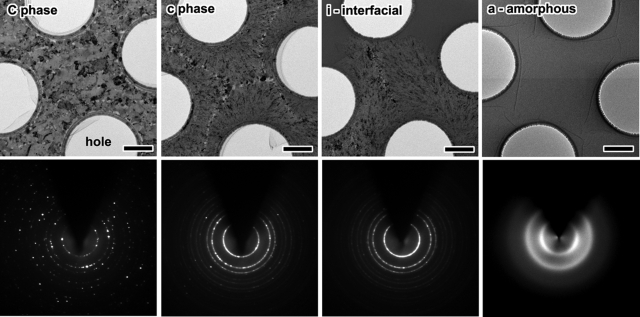
Fig. 2.
Images and electron diffraction patterns taken with the microscope at higher magnification (TEM) for the different phases of Fig. 1. (Scale bar: 1 μm.) All diffraction patterns were obtained by using a selected-area diffraction (SAD) aperture of 6 μm diameter of the specimen. The dark areas in the images are crystallites with orientation (of enhanced contrast) closely parallel to the incident electron beam. Holes are present in the polymeric substrate (and specimen), and their diameter is measured to be 2.4 μm. Note that the diversity in crystallinity in the diffraction images is reflected in the morphology.

