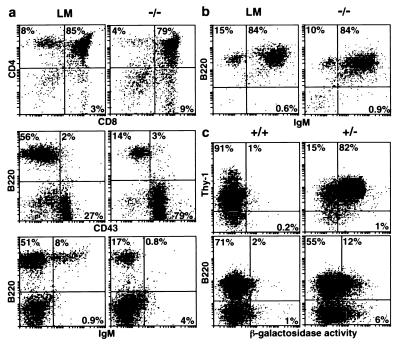
Figure 3.
Lymphocyte profiles in SOCS-1−/− mice. (a) Fluorescence-activated cell sorter analysis showing unaltered distribution of thymocytes expressing the CD4 and CD8 cell surface markers and the deficiency in pre-B and B (B220+CD43−) as well as mature B cells (B220+IgM+) in the bone marrow of a representative SOCS-1−/− mouse. Profiles of the equivalent populations from age-matched littermate mice (LM) are shown for comparison. (b) Analysis of cultures of bone marrow cells from SOCS-1−/− and littermate (LM) mice showing similar in vitro capacity for B cell (B220+IgM+) maturation. (c) Double-staining with β-galactosidase and Thy-1 (thymus) or B220 (spleen) from heterozygous SOCS-1+/− and wild-type mice demonstrating transcriptional activity of the SOCS-1 locus in thymocytes and B-lymphoid cells.

