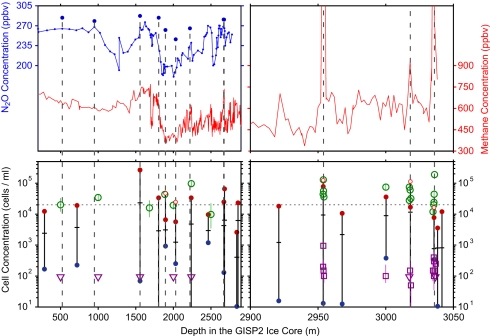
Fig. 2.
Depth dependence of N2O (13) and CH4 (14, 15) concentrations (Upper) and of microbial concentrations (Lower) inferred from our scans of protein-bound Trp fluorescence (proxy for microbial cells) and from direct counts of methanogens by F420 epifluorescence microscopy in the GISP2 ice core. Red points above the horizontal dashed line show excess Trp; green circles above the dashed line are excess cells by direct counts.

