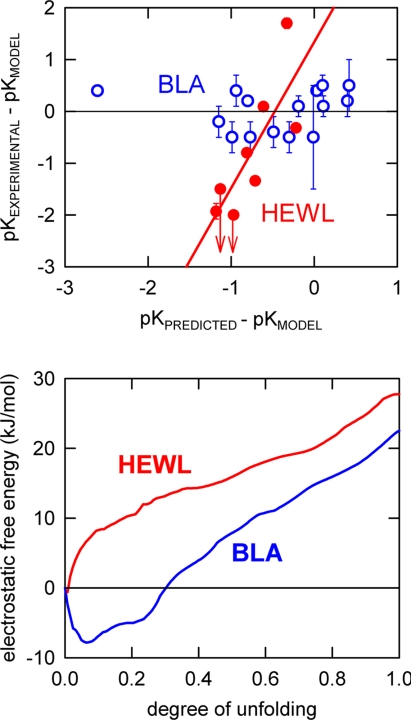
Fig. 4.
Electrostatics and thermodynamic folding barriers. (Upper) Plot of experimental pK values versus TK-predicted pK values for carboxylic acid groups in HEWL and holo-BLA. The values (both experimental and predicted) are referenced to characteristic pK values of 4 for Asp and 4.5 for Glu. Other model pK values (61) produce a similar plot. The points labeled with arrows correspond to pK values reported as ≤2 and ≤2.5. (Lower) Profiles of the calculated TK electrostatic free energy versus degree of unfolding.

