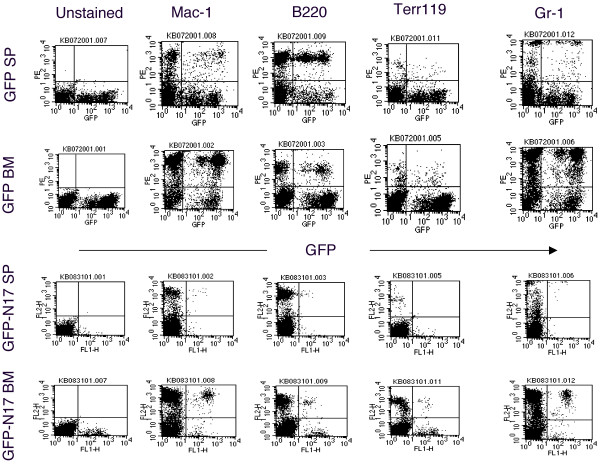
Figure 1.
Flow cytometric analysis of spleen and bone marrow cells from N17 H-Ras and GFP control mice. Expression of GFP (X-axis) and Mac-1, B220, Terr-119, or Gr-1 (Y-axis) in bone marrow cells and splenocytes isolated from N17 H-Ras and GFP control mice was analyzed by flow cytometry. Results are representative of one of the three independent experiments.

