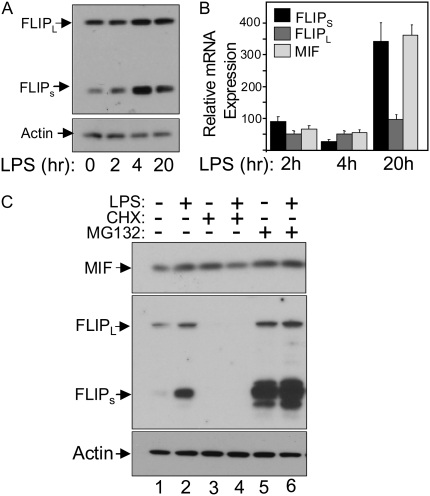
Figure 4.
LPS induces a rapid increase in FLIPs protein levels. (A) Changes in FLIPL, FLIPs, and β-actin protein levels in HPAEC in response to LPS. HPAEC were exposed to 100 ng/ml LPS and then harvested at the indicated times and processed for Western blotting. LPS induced a rapid increase in FLIPs protein levels without significantly affecting FLIPL levels. (B) HPAEC were treated with LPS as described above and harvested at the indicated times for total RNA isolation followed by quantitative RT-PCR for FLIPL, FLIPs, MIF, and β-actin mRNA. Results are presented relative to unstimulated cells and normalized to β-actin levels. (C) Changes in FLIPL, FLIPs, and MIF protein levels in HPAEC 4 hours after the addition of the protein synthesis inhibitor CHX (10 μM) or the proteasome inhibitor MG-132 (1 μM) with and without addition of 100 ng/ml LPS. Lanes 1 and 2 show the increase in FLIPs protein caused by 4 hours of LPS exposure. Lanes 3 and 4 show that both FLIPs and FLIPL protein levels are markedly reduced once protein synthesis is inhibited, while lanes 5 and 6 show a disproportionate effect of inhibiting proteasomal-mediated degradation on FLIPs, compared with FLIPL.

