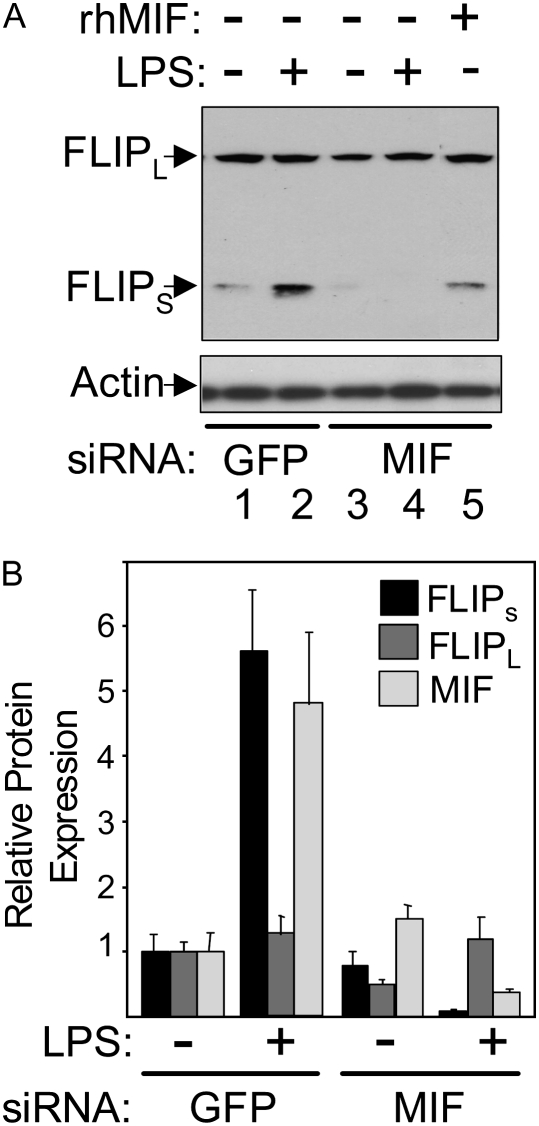
Figure 5.
Changes in FLIPs protein levels in response to LPS are dependent on MIF. (A) FLIPs and FLIPL protein levels were measured in control/GFP siRNA– and MIF siRNA–transfected HPAEC before and 4 hours after LPS stimulation. Lanes 1 and 2 show the increase in FLIPs expression seen with LPS, while the comparison of lanes 3 and 4 shows that this increase is not only prevented by suppression of MIF but that FLIPs levels fall below basal. Lane 5 shows that addition of rHMIF prevents the decline in FLIPs protein levels caused by MIF siRNA. (B) Graphical representation of relative changes in FLIPs, FLIPL, and MIF protein levels after normalization to β-actin expression from three independent experiments. The normalized value for each protein in unstimulated control/GFP siRNA–transfected cells was arbitrarily set at 1, with all changes in expression referenced to this point.

