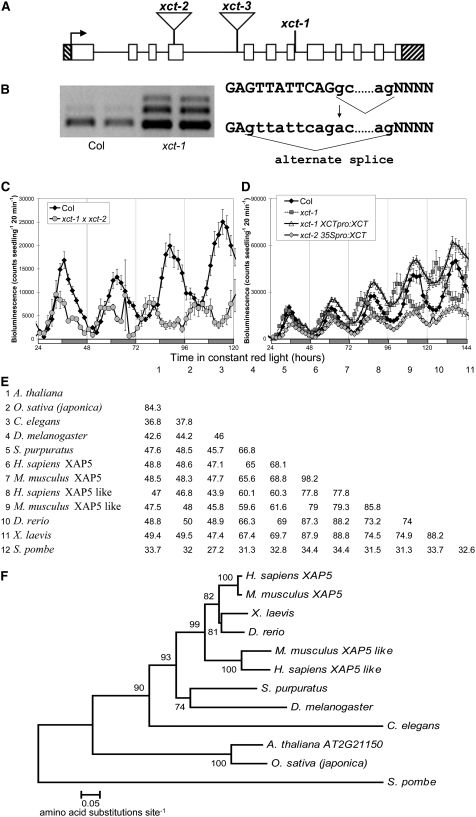
Figure 2.
Identification of the XCT Locus.
(A) Gene structure of XCT: white blocks indicate exons and black lines introns; hatched bars indicate the 5′ and 3′ UTRs. Locations of mutations are indicated: xct-1 G1712A, xct-2 (SALK_134513) insertion after 771 nucleotides, and xct-3 (SALK_108639) insertion after 1287 nucleotides.
(B) xct-1 contains a G→A transition 1712 nucleotides after the translational start, which alters a 5′ intronic splice site and leads to missplicing of the XCT message.
(C) xct-2 fails to complement xct-1, with the F1 demonstrating a short period similar to both parents.
(D) xct-1 was rescued by transformation with XCT under the control of its own promoter (xct-1 XCTpro:XCT), and overexpression of XCT by the 35S promoter also produced a near normal free-running period in xct-2 (xct-2 35Spro:XCT, P > 0.1). For (C) and (D), plants were entrained and assayed as in Figure 1B, and error bars represent se.
(E) Percentage of identical amino acids between species across the entire XAP5 protein is presented in a similarity matrix.
(F) Neighbor-joining phylogenetic tree showing the relationships between XAP5 proteins from various species. Bootstrap values (10,000 replicates) are presented near each branch, and branch length represents the number of amino acid changes per site in accordance with the scale bar. Species of XAP5 proteins in (E) and (F) are Arabidopsis thaliana, Oryza sativa, Mus musculus, Strongylocentrotus purpuratus, Homo sapiens, Xenopus laevis, Danio rerio, Drosophila melanogaster, Caenorhabditis elegans, and Schizosaccharomyces pombe.

