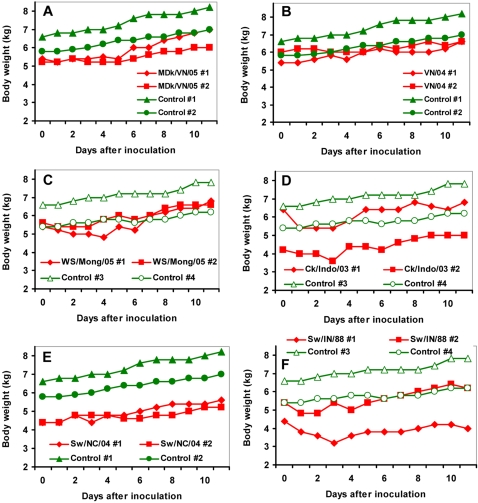
Figure 2. Pig weight changes during influenza virus infection.
Shown are results for the two infected pigs for each virus treatment group (pigs #1 and #2); compared to one of two independent control groups (control pigs #1 and #2, or control pigs #3 and #4). H5N1 influenza viruses: MDk/VN/05 (A), VN/04 (B), WS/Mong/05 (C), and Ck/Indo/03 (D). Swine H3N2 (E) and H1N1 (F) influenza viruses.

