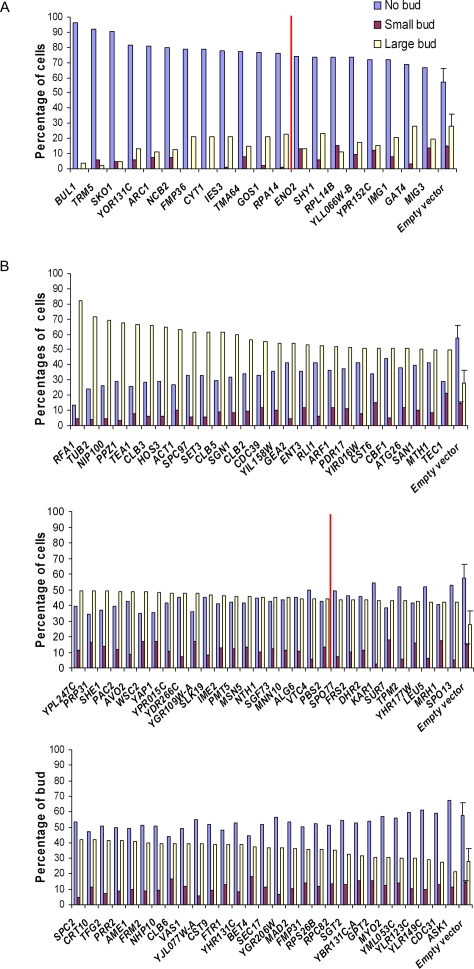
Figure 3. Independent support for cell cycle delays from histograms of the percentages of cells with no bud, small bud or large bud.
(A) shows bud size measurements of strains in the G1 category. Strains are sorted by their percentages of cells without buds. All strains show higher proportions of cells than control strains; 13 strains are more than two standard deviations higher (indicated by red line) than the empty vector control strains (plotted+/−1 s.d.). (B) shows bud size measurements of strains in the G2/M category. Strains are sorted by percentages of cells with large buds. 85 strains showed higher percentages of large-budded cells than empty vector control strains; 47 of these were more than two standard deviations above control strains (indicated by red line). In all plots, ORF gene names are indicated in x-axis, percentages of cells on the y-axis.

