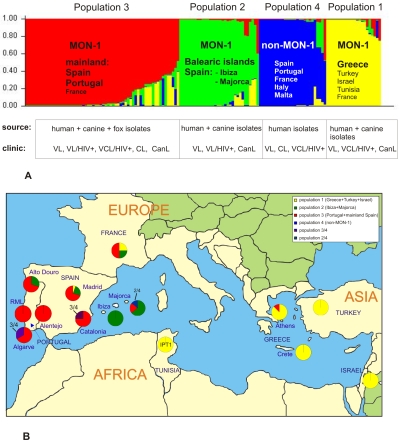
Figure 1. Population structure of Mediterranean L. infantum as inferred by STRUCTURE on the basis of data for 14 microsatellite markers obtained for 141 strains.
(A) Barplot for K = 4-each of the strains is represented by a single vertical line divided into K colors, where K is the number of populations assumed. Each color represents one population, and the length of the colors segment shows the strain's estimated proportion of membership in that population. (B) Distribution of Mediterranean L. infantum MON-1 strains belonging to populations 1–3 in the respective endemic foci. Pie-charts show the proportion of each population sampled in the respective geographical region. Colors correspond to the population specific ones in Figure 1A.

