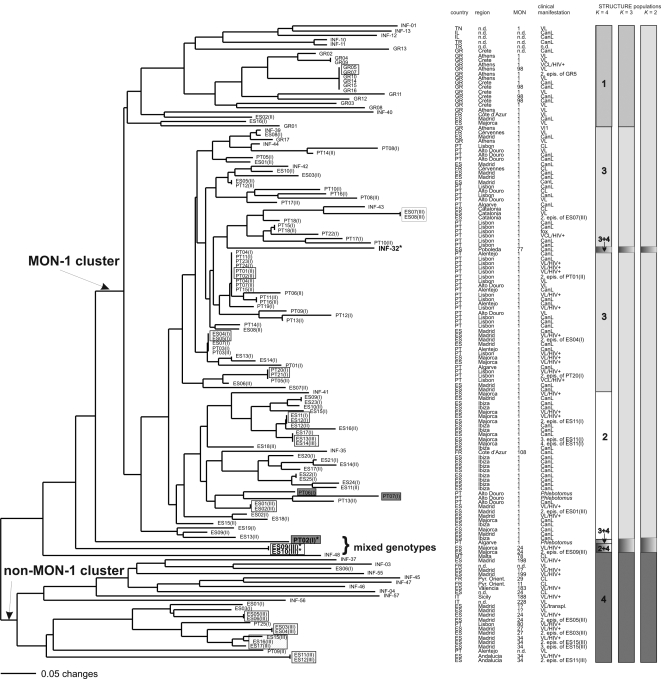
Figure 2. Neighbor-joining tree inferred from Dps-distances calculated for the data of 14 microsatellite markers and all 141 L. infantum strains.
Geographical origins, zymodemes and clinical manifestation are shown. Phlebotomus strains are marked by grey rectangles, relapses by white rectangles. Four strains with mixed MON-1/non-MON-1 ancestry are marked by an asterix. Populations as inferred by STRUCTURE K = 2, K = 3 and K = 4 are indicated by bars in different colors next to the tree. Midpoint rooting was applied for the NJ tree, no outgroup has been used.

