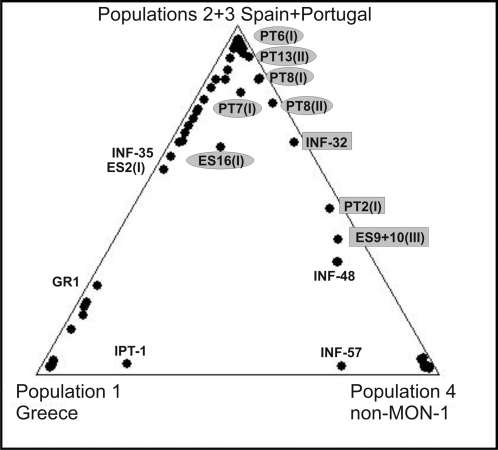
Figure 3. Traces of gene flow between the L. infantum populations shown by a triangle plot.
The triangle plot of proportion of ancestry from three sources designated population 1 (Greece), population 4 (non-MON-1) and combined populations 2 and 3 (Majorca/Ibiza and mainland Spain and Portugal) as inferred from K = 4 in STRUCTURE analysis shows traces of gene flow between the populations. Each data point corresponds to a single strain whose proportion of ancestry from each of the three sourcesis represented by its proximity to the corresponding corner of the triangle. Strains of mixed MON-1/non-MON-1 ancestry and mosaic genotypes are labeled in grey (rectangles-most of the loci are heterozygous; ellipses-few loci are heterozygous). ES16(I) is homozygous for all loci, however representing a combination of alleles typical for different populations.

