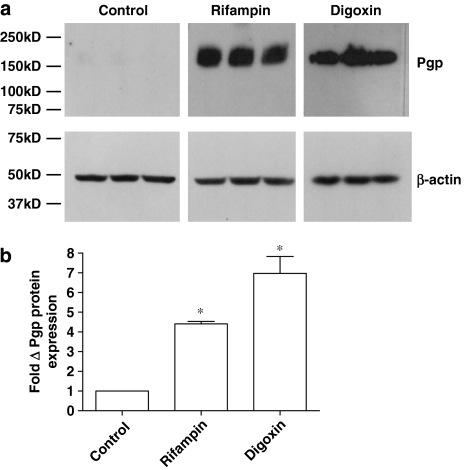
Figure 7.
(a) Western blot analysis of MDR1 protein expression in T84 cell monolayers following 72 h of exposure to rifampin (10 μM) and digoxin (1 μM). A 50-μg weight of control (0.1% DMSO) and rifampin-treated protein, and 25 μg of digoxin-treated T84 protein was loaded into each lane, with bands representing protein from three separate cell layers for each condition. (b) Band intensity was determined by densitometry and normalized to β-actin protein levels. *Significantly different from control values; P<0.05. Data are expressed as±s.e.mean, n=3 samples. DMSO, dimethyl sulphoxide; MDR1, multidrug resistance 1.

