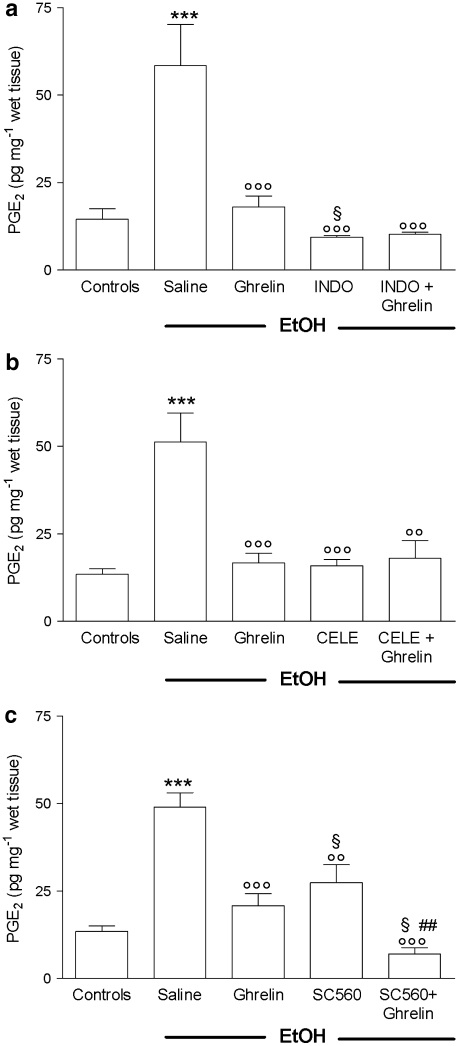
Figure 2.
Effects of ghrelin (4 μg per rat, i.c.v.), with or without pretreatment (30 min before) with (a) INDO (10 mg kg−1, p.o.), (b) CELE (3.5 mg kg−1, p.o.) or (c) SC560 (5 mg kg−1, p.o.) on gastric mucosal PGE2 levels determined 60 min after oral administration of 1 mL 50% (vol./vol.) EtOH. The saline group received 1 mL of distilled water instead of 50% EtOH. PGE2 was extracted from homogenized gastric mucosa and measured by EIA. Each column represents the mean±s.e.mean of at least 10 animals. ***P<0.001 vs control group; ○○P< 0.01, ○○○P<0.001 vs saline+EtOH group; §P<0.05 vs ghrelin+EtOH group, ##P<0.01 vs SC560+EtOH group. CELE, celecoxib; EIA, enzyme immunoassay; EtOH, ethanol; i.c.v., intracerebroventricular; INDO, indomethacin; PGE2, prostaglandin E2.

