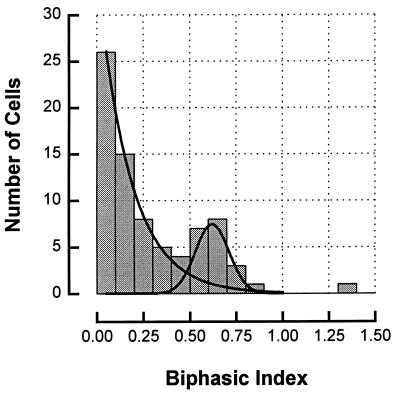
Figure 2.
Distribution of the biphasic index (amplitude of second temporal peak/amplitude of first) for all the nondirectional cells in our study. The distribution is biphasic and is well fit, as shown, by a sum of an exponential and a gaussian (solid line). Cells with biphasic indices of more than 0.5 (the second-phase half or more as large as the first) were categorized as strongly biphasic. Those with indices of less than 0.3 were categorized as weakly biphasic, and cells between 0.3 and 0.5 were not included in the analysis, as being ambiguous.

