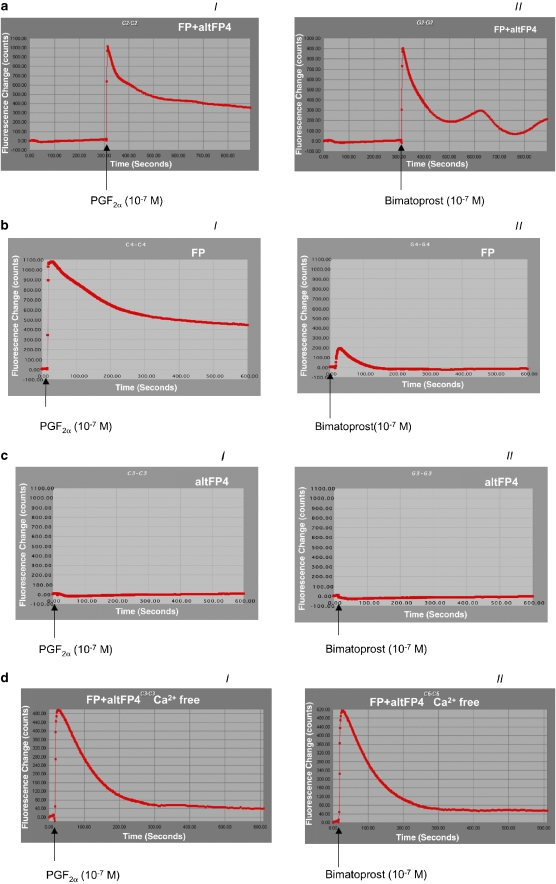
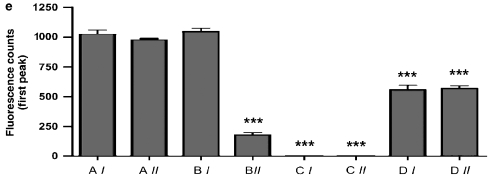
Figure 4.
Ca2+ signalling of HEK293/EBNA cells co-expressing FP and altFP4 receptors following prostaglandin F2α (PGF2α) and bimatoprost treatments. (a) Real-time fluorescence traces were recorded by fluorometric imaging plate reader (FLIPR) in HEK293/EBNA cells co-expressing FP and altFP4 receptors following PGF2α (10−7 M) or bimatoprost (10−7 M) treatment. (I) After recording baseline for 300 s, 10−7 M PGF2α was added and recorded for additional 600 s. (II) After recording baseline for 300 s, 10−7 M bimatoprost was added and recorded for additional 600 s. (b) Real-time fluorescence traces were recorded by FLIPR following PGF2α (10−7 M, I) or bimatoprost (10−7 M, II) in HEK293/EBNA cells expressing wt-FP receptor. Real-time fluorescence traces were recorded immediately following PGF2α (10−7 M) or bimatoprost (10−7 M) treatment. (c) Real-time fluorescence traces were recorded by FLIPR in HEK293/EBNA cells expressing altFP4 receptor following PGF2α (10−7 M, I) or bimatoprost (10−7 M, II) treatment for 600 s. (d) Real-time fluorescence traces were recorded by FLIPR in HEK293/EBNA cells co-expressing FP and altFP4 receptors following PGF2α (10−7 M, I) or bimatoprost (10−7 M, II) treatment in Ca2+-free buffer for 600 s. (e) The first peak increase of fluorescence counts was recorded in each treatment (aI–dII). The data represent mean±s.d. of three independent experiments. ***P<0.01 versus PGF2α treatment (aI).


