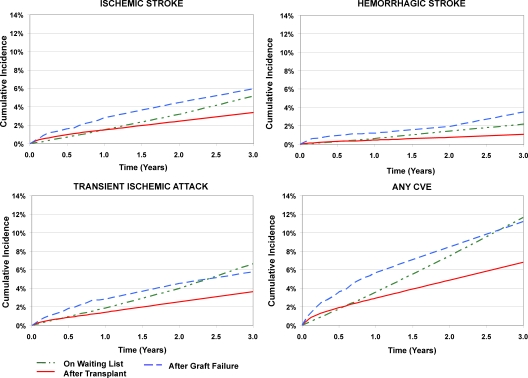
Figure 2.
Incidence of new-onset cerebrovascular events by kidney transplant status, with adjustment to the average characteristics of the study sample that underwent transplantation. Waiting list incidence was censored at transplantation; incidence after transplantation was censored at graft failure. Incidence estimates on the waiting list and after transplantation were computed by Cox regression, with adjustment of significant event correlates to the average values of the study sample that underwent transplantation.

