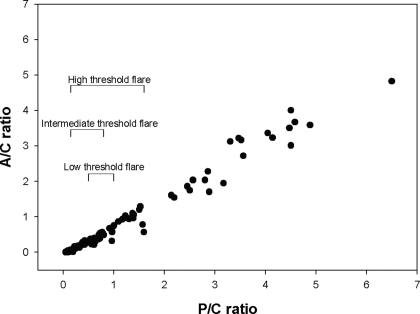
Figure 1.
Relationship between protein (P)-creatinine (C) and albumin (A)-C ratios in the 24-h urine collections (n = 127) of the patients with systemic lupus erythematosus glomerulonephritis (SLE GN; n = 57) in this study. Also shown are representative minimum P-C ratio changes for a proteinuric renal flare according to whether low-, intermediate-, or high-threshold criteria are used. The flare criteria have been adjusted so that they correspond to changes in P-C ratio (see the Materials and Methods). As shown, P-C and A-C ratios are highly correlated over the entire range of the P-C ratios (slope = 0.79, r = 0.99, P < 0.0001).

