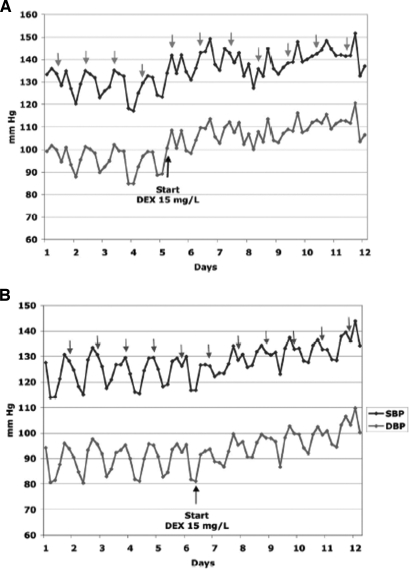
Figure 2.
Differential BP response to DEX in Sm-22 Cre+ GRloxP/loxP versus Cre− control. (A and B) Representative BP tracing of a control mouse (A) and an Sm-22 Cre+ GRloxP/loxP mouse (B) in response to DEX 15 mg/L in the drinking water. The top line is SBP, and the bottom line is DBP. Each point represents the time-averaged BP over a 4-h period. Arrows indicate the time period from 8 p.m. to midnight, usually the time of peak circadian BP variation in the nocturnal mouse. Both the Cre+ and Cre− mice demonstrate a clear pattern of circadian variation, with the peak BP generally occurring at or near the period of 8 p.m. to midnight. After the initiation of DEX, there is a clear loss of normal diurnal variation in each of these mice; however, whereas BP rises rapidly and substantially in the Cre− mouse, the rise in BP in the Cre+ mouse is attenuated.

