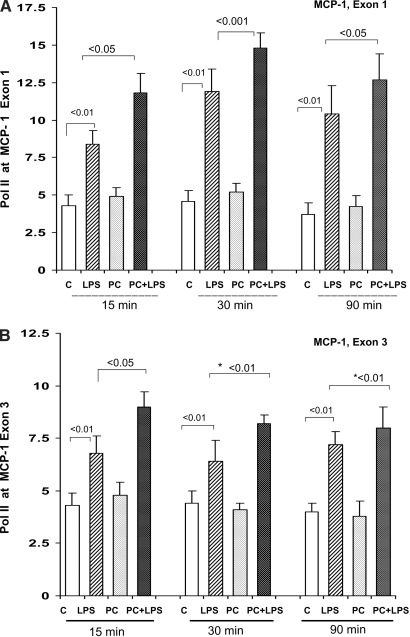
Figure 3.
(A and B) LPS-PC: Pol II levels at start and end exons (1 and 3) of the MCP-1 gene. The preconditioned and control mice had comparable degrees of Pol II at both MCP-1 exons. When rechallenged with LPS, greater increases were observed in the preconditioned mice, compared with LPS-injected naive controls, particularly at the 15-min time point (*overall statistical analysis for all time points, exon 3, P < 0.01).

