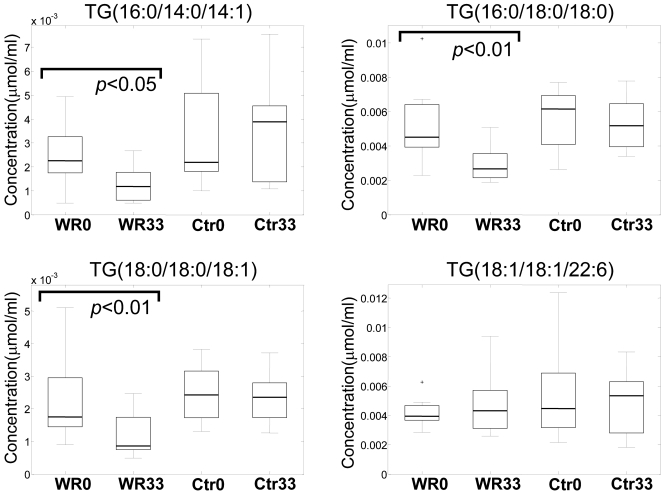
Figure 3. Box plots for four selected triacylglycerol (TG) lipids in the weight reduction group before (WR0) and after (WR33) intervention, as well as for the control group before (Ctr0) and after (Ctr33) intervention.
The fatty acid composition of the individual acyls of the respective TG particles are shown in parentheses.

