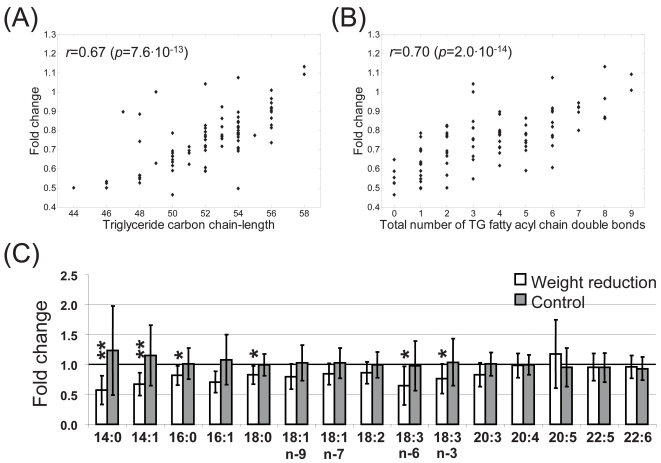
Figure 5. Spearman rank correlation between the fold change of triacylglycerol molecular species after and before the intervention in weight reduction group, and the corresponding (A) total TG fatty acid carbon chain length and (B) degree of TG fatty acid unsaturation.
(C) Changes in esterified fatty acid composition in weight reduction and control groups, as obtained by gas chromatography based fatty acid measurement. p-values were calculated using paired samples t-test (*p<0.05, **p<0.01).

