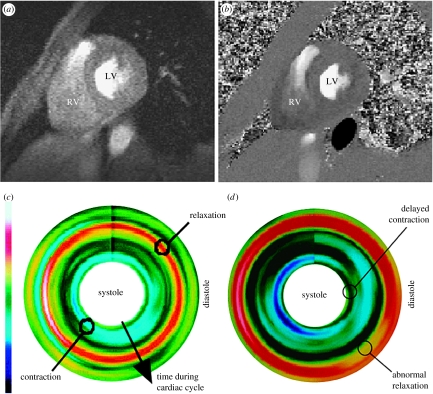
Figure 4.
Assessment of myocardial contractility with high sensitivity MR velocity imaging. (a) Anatomical structure of the image plane, (b) MR velocity measurement, (c) reconstructed longitudinal contractility mapping showing uniform contraction (sky blue) during systole and relaxation (red) during diastole for a normal subject and (d) contractility mapping for a patient with ischaemic heart disease, showing delayed contraction during systole and abnormal relaxation (broken and broadened red strip) during diastole.

